Splunk 基本语法
| 功能 | 语法 |
|---|---|
| average | stats avg(duration) by ... |
| sort | sort -_time, sort _time |
| replace | rex mode=sed field=url "s/aa(a)/zz\1/" |
Regular Expression match
rex field=_raw "\"(?<msg>[^\[]+)\"" |table msg
Parse JSON string
如果 Splunk _raw data = {"user": {"id":"2134"}} ,我们可以用 spath 来 parse JSON string
spath json=_raw |table user.id
Parse JSON array
如果 Splunk _raw data = {"users": [{"id":"2134"},{"id":"2135"}]} ,我们可以用 spath + mvexpand 来 parse JSON string
spath json=_raw path=users{} output=x | mvexpand x | spath input=x | table id
mvexpand 的意思是把 users array 摊开成多笔资料,所以这个 example 会得到两笔 id
Parse 特殊字元
如果 _raw data 中有反斜线,那么可以使用 [^a] ,利用 非 a 来判断
- rex field=raw "[^a]\"id[^a]\":[^a]\"(?<id>[^\"]+)[^a]\""
deocde unicode
如果你的 log value 有这种 unicode 格式 "\u8338\u5125\u6163\u78ba\u3684\u5716\u" ,可以透过 spath 来处理。
我给的 example ,斜线 "\" 是两个,首先我用 sed 将斜线泸掉一个 。
- rex mode=sed field=data "s/[\\\]+/\\\/g"
再将 data 字串转成 json object ,然后透过 spath 分析 json,就可以成功取出 decode 过的中文字。
- eval data="{\"msg\":\"" + data + "\"}" | spath input=data | table msg
判定某变数是否为空白
eval hasSubtitle = if (subtitle !="", "1", "0")
处理空白资料
eval serverId = if (isnull(serverId), "unknow", serverId)
用 search 泸掉不要的资料
search id=123
search price >= 100
滤掉 url 后面的 Query String
rex field=url "(?
计算 percentage
- | stats count by url
- | eventstats sum(count) as total
- | eval percent = round(100 * count/total) . " %"
- | table url,count,percent
比对字串是否包含某个字元
eval req500=mvfind(status, "500")
如果 status 有 500 这个字, req500 会等於 "0"
使用 eval 增加一个新变数时,不能使用数字开头的变数,否则在 if condition 中会有问题。
统计各 device 流量
eval isIOS=mvfind(agent, "iOS") | eval isAndroid=mvfind(agent, "android") | eval isWeb = if(isnull(isIOS), if(isnull(isAndroid), 0, 1), 1) | eval device = if(isnull(isIOS), if(isnull(isAndroid), "Web" , "Android") , "iOS") | stats count by device
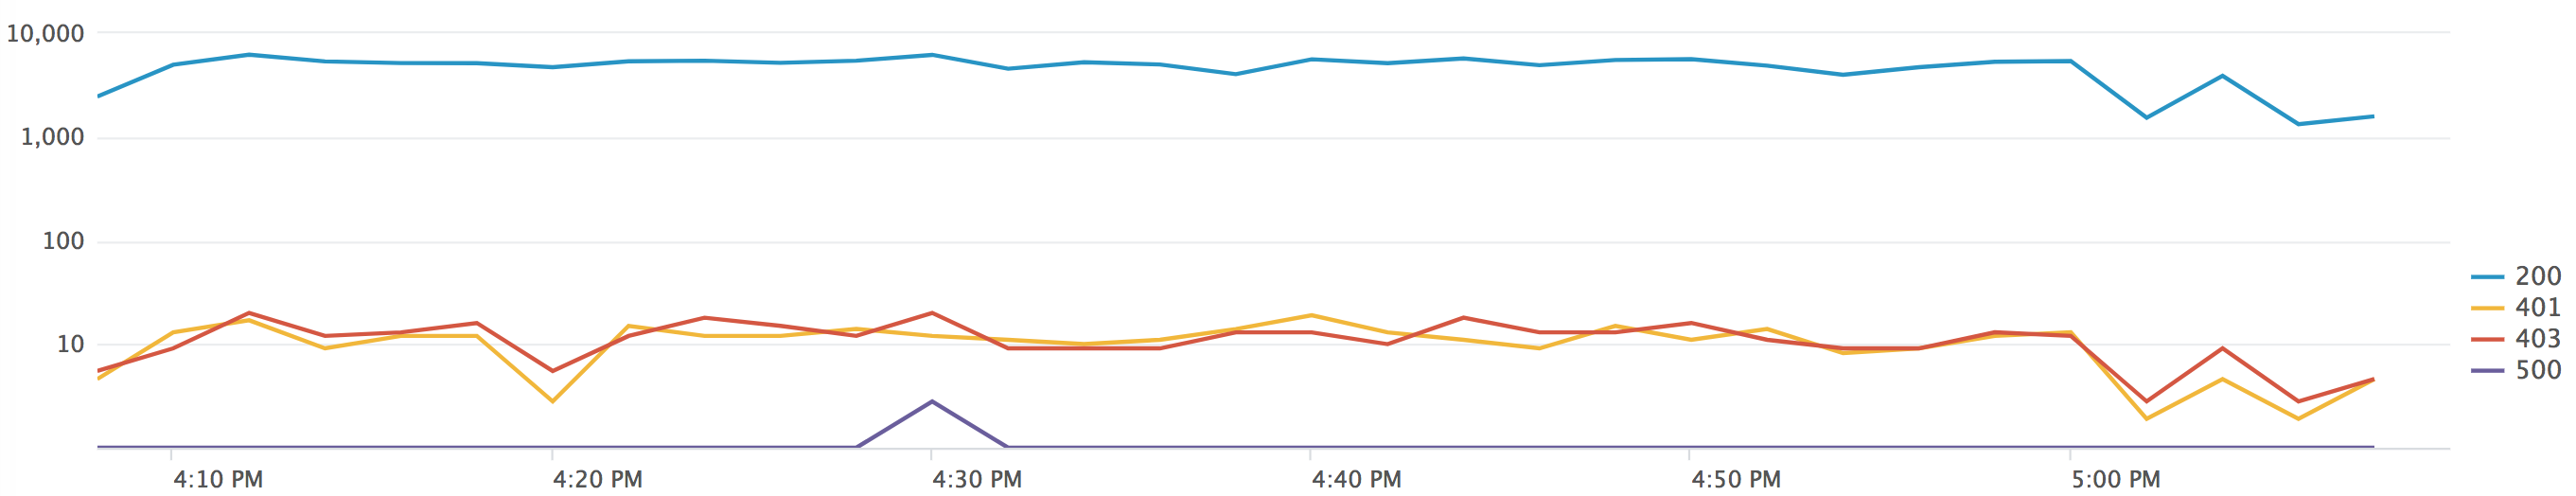
图表
利用 timechart 统计 HTTP status
- | timechart span=1m count(eval(status="200")) AS 200,count(eval(status="401")) AS 401, count(eval(status="403")) AS 403 , count(eval(status="500")) AS 500
- span=1m 代表每一分钟统计一次
每 10 分钟统计一次 QPS
index=xx_access-log | bucket _time span=10m | stats count by _time | eval QPS=count/600 |table _time,count,QPS
join 两个 index
通常 Web service 会有两种 log : access log 与 error log ,只要两个 log 有一个共同的 id ,那么我们就可以透过 join 的功能将它们合并 ,范例中我的 access log 有个 accessId ,而在 error log 中有个 logId ,一个 Request 的 accessId and logId 值是相同的,合并方式如下。
index=access_log method="POST" url="*xxx*" | eval logId=accessId | stats values(url) AS url, values(_time) as _time ,values(host) as host by logId | join type=left logId [search _raw="*exception*" index=error_log | stats values(_raw) as error by logId ]
时间处理
- 转成看得懂的时间 eval date=strftime(_time, "%m/%d/%Y")- _time 转成 timestamp: eval time1=strptime(_time,"%s")
y 轴显示多条线图
比较各项目时间轴的线图,例如画出每台机器各时间的流量
index=xx | table _time,service | bucket span=1m _time |chart count OVER _time BY service
Dashboard 选单 dropdown 用法
当我选择其中一个选项,要同时改变多个变数
- <form>
- <label>Dashboard</label>
- <fieldset submitButton="false">
- <input type="dropdown" token="service">
- <label>Service Name</label>
- <choice value="articles">Article</choice>
- <choice value="products">Product</choice>
- <initialValue>products</initialValue>
- <change>
- <condition value="articles">
- <set token="index">articles_index</set>
- <set token="host">articles-.*.com</set>
- </condition>
- <condition value="products">
- <set token="index">products_index</set>
- <set token="host">products-.*.com</set>
- </condition>
- </change>
- <row>
- <panel>
- <title>Panel 1</title>
- <table>
- <search>
- <query>index=$index$ host=$host$
- <earliest>$time.earliest$</earliest>
- <latest>$time.latest$</latest>
- </search>
- </table>
- </panel>
- </row>
- </form>